Géologie et exploration
Isopach
Dévoiler les Secrets de la Terre : Comprendre les Isopaques et leur Rôle en Géologie
Les isopaques, un concept fondamental en géologie, fournissent des informations cruciales sur la distribution et l'épaisseur des formations géologiques, ouvrant la voie à une compréhension plus profonde de l'histoire de la Terre et du potentiel des ressources. Plongeons dans le monde des isopaques et explorons leur importance.
Que sont les Isopaques ?
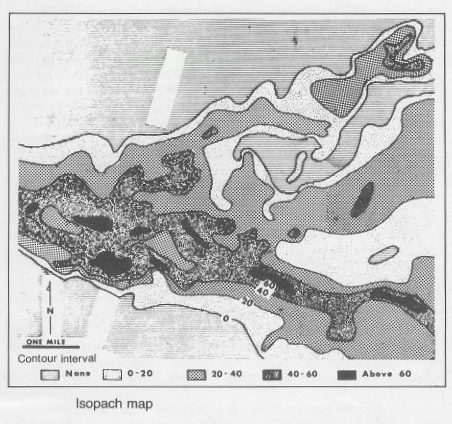
Le terme "isopaque" trouve son origine dans les mots grecs "isos" (égal) et "pachys" (épais). En termes simples, une isopaque est une ligne sur une carte qui relie des points d'égale épaisseur de formation. Elle agit comme une ligne de contour, représentant les variations d'épaisseur d'une unité géologique spécifique sur une zone donnée.
Pourquoi les Isopaques sont-elles Importantes ?
Les cartes d'isopaques sont des outils précieux pour les géologues et autres scientifiques de la Terre pour plusieurs raisons :
- Comprendre les Modèles de Sédimentation : Elles révèlent la distribution des sédiments au fil du temps, offrant des indices sur les anciens environnements de dépôt, la paléogéographie et l'activité tectonique.
- Estimer le Potentiel des Ressources : Les isopaques peuvent aider à prédire la présence et l'étendue de ressources précieuses comme le pétrole, le gaz et les minerais, guidant les efforts d'exploration.
- Analyser la Subsidence et le Soulèvement : En comparant les isopaques de différentes unités géologiques, les géologues peuvent déduire les zones de subsidence ou de soulèvement, éclairant les événements tectoniques régionaux.
- Évaluer les Ressources en Eau Souterraine : Les isopaques des aquifères aident à déterminer le volume d'eau disponible dans une région, favorisant la gestion des ressources en eau.
- Comprendre les Relations Stratigraphiques : Les cartes d'isopaques facilitent l'interprétation des relations stratigraphiques entre différentes unités géologiques, offrant une image plus claire de l'histoire géologique d'une région.
Comment les Cartes d'Isopaques sont-elles Créées ?
Les cartes d'isopaques sont généralement construites à partir de données provenant de :
- Logs de Puits : Des enregistrements détaillés des formations souterraines rencontrées lors des opérations de forage.
- Surveys Sismiques : Des méthodes géophysiques qui fournissent des informations sur la structure souterraine.
- Données d'Affleurement : Des observations de formations géologiques exposées à la surface.
Ces données sont analysées et compilées pour déterminer l'épaisseur de la formation à divers endroits, qui sont ensuite utilisés pour créer des lignes d'isopaques reliant des points d'égale épaisseur.
Au-delà de l'Épaisseur : Considérations de Profondeur
Bien que les isopaques représentent principalement l'épaisseur de la formation, elles peuvent également être utilisées pour représenter la profondeur d'une zone spécifique. Par exemple, une carte d'isopaques peut illustrer la profondeur de la base d'une unité sédimentaire particulière ou la profondeur d'un horizon géologique marquant particulier. Ces informations sont cruciales pour comprendre la géométrie souterraine et guider les activités d'exploration et de développement des ressources.
Conclusion
Les isopaques sont des outils essentiels pour débloquer les mystères de l'histoire et des ressources de la Terre. En comprenant les principes à la base de la cartographie des isopaques, nous acquérons une compréhension plus approfondie des processus complexes qui ont façonné notre planète, guidant finalement notre compréhension et notre utilisation de ses vastes ressources.
Test Your Knowledge
Isopachs Quiz
Instructions: Choose the best answer for each question.
1. What does the term "isopach" literally mean? a) Equal depth b) Equal thickness c) Equal area d) Equal age
Answer
b) Equal thickness
2. Which of the following is NOT a reason why isopach maps are important in geology? a) Understanding sedimentation patterns b) Predicting resource potential c) Identifying areas of earthquake risk d) Analyzing subsidence and uplift
Answer
c) Identifying areas of earthquake risk
3. What type of data is typically used to create isopach maps? a) Weather records b) Satellite imagery c) Well logs and seismic surveys d) Fossil data
Answer
c) Well logs and seismic surveys
4. Isopach maps can be used to represent the depth of a specific zone. What is an example of such a zone? a) The depth of the ocean floor b) The depth to the base of a sedimentary unit c) The depth of a volcanic crater d) The depth of a riverbed
Answer
b) The depth to the base of a sedimentary unit
5. What is the primary purpose of isopachs? a) To illustrate the distribution of different rock types b) To depict the age of geological formations c) To map the location of faults and folds d) To connect points of equal formation thickness
Answer
d) To connect points of equal formation thickness
Isopach Exercise
Instructions:
You have been given a geological map showing the thickness of a specific sedimentary unit across a region. The map includes isopach lines representing the thickness of the unit in meters.
Task:
- Identify the areas with the thickest and thinnest sediment accumulation.
- Interpret the potential reasons for the variations in thickness. Consider factors like depositional environments, tectonic activity, and erosion.
- Describe how the isopach information could be used for potential resource exploration.
Example:
Imagine a map showing the thickest sediment accumulation in a basin surrounded by areas of thinner deposits. This could suggest a former depocenter where sediments were deposited more rapidly. The isopach information could then be used to guide exploration for resources potentially trapped within the thickest sediment layers.
Exercice Correction
This exercise is designed to test your understanding of how isopachs can be used to interpret geological processes. You will need to analyze the provided map and consider various factors influencing sediment accumulation. Here's a breakdown of the steps and possible answers: 1. **Identifying areas with thickest and thinnest accumulation:** - **Thickest:** Locate the areas where isopach lines have higher values, indicating a greater thickness of the sedimentary unit. - **Thinnest:** Locate the areas where isopach lines have lower values, indicating a thinner deposit. 2. **Interpreting variations in thickness:** - **Depositional environments:** Analyze if the thickest areas correspond to environments conducive to sediment accumulation, such as basins, valleys, or areas receiving sediment from rivers. - **Tectonic activity:** Look for any structural features that might have influenced sediment deposition. For instance, a downthrown block (graben) might have received thicker sediment than an uplifted block (horst). - **Erosion:** Consider areas where isopachs thin out or disappear. This could indicate erosion or removal of sediment due to uplift or changes in sea level. 3. **Resource exploration:** - **Potential reservoirs:** Areas with thick sediment accumulation might be promising locations for hydrocarbon reservoirs, aquifers, or mineral deposits, depending on the type of sediment. - **Stratigraphic traps:** Variations in thickness could indicate areas where geological formations create traps for hydrocarbons or groundwater. Remember to analyze the specific map and consider the factors relevant to the given context.
Books
- Petroleum Geology by Robert J. E. (Chapter on Structure Maps and Isopachs)
- Sedimentary Geology by Reinoud (Chapter on Stratigraphic Analysis and Isopach Maps)
- Geologic Maps by (Chapter on Isopach Maps and Contouring)
- Principles of Stratigraphy by (Chapter on Isopach Analysis and Time-Stratigraphy)
- Geological Structures and Maps by (Chapter on Isopachs and Structural Interpretation)
Articles
- "Isopach Mapping for the Estimation of Reservoir Thickness in the X Oil Field" by (Journal of Petroleum Science and Engineering)
- "Isopach Analysis and its Application in the Interpretation of Sedimentary Basins" by (Journal of Geological Society of India)
- "The Use of Isopach Maps in the Prediction of Groundwater Potential" by (Hydrogeology Journal)
- "Isopach Mapping and its Application in the Determination of Sedimentary Facies" by (Journal of Sedimentary Research)
- "Isopach Analysis and its Importance in Understanding Depositional Environments" by (Geological Society of America Bulletin)
Online Resources
- "Isopach Maps" on the USGS website: Provides a general overview of isopach maps and their applications.
- "Isopach Map" on Wikipedia: Offers a brief definition and explanation of isopachs.
- "Geologic Maps and Isopachs" on the University of Texas at Austin website: Includes a comprehensive explanation of isopach maps and their construction.
- "Isopach Analysis" on the GeoScienceWorld website: Provides a collection of research articles related to isopach analysis.
- "Isopach Map: Definition, Construction, and Applications" on the Geology.com website: A detailed article covering the definition, construction, and applications of isopach maps.
Search Tips
- Use keywords like "isopach map", "isopach analysis", "isopach construction", "isopach applications", "isopach examples".
- Combine keywords with specific geological formations, resources, or regions of interest.
- Use specific journal names and authors to find relevant research articles.
- Explore related search terms like "structure maps", "contour maps", "thickness maps", and "stratigraphic maps".
Techniques
Unveiling Earth's Secrets: Understanding Isopachs and Their Role in Geology
This document expands on the provided text, dividing the information into chapters focusing on Techniques, Models, Software, Best Practices, and Case Studies related to isopachs.
Chapter 1: Techniques for Isopach Mapping
The creation of accurate isopach maps relies on several key techniques for data acquisition and analysis. These techniques often involve a combination of approaches to ensure comprehensive coverage and minimize uncertainties:
Well Log Analysis: Well logs provide detailed information on subsurface stratigraphy, including formation thicknesses. Techniques used include:
- Gamma ray logs: Identify lithological changes and aid in correlating strata between wells.
- Sonic logs: Measure the velocity of sound waves through formations, helping to determine lithology and porosity, indirectly informing thickness calculations.
- Resistivity logs: Measure the electrical conductivity of formations, useful in identifying fluid-filled zones and distinguishing between different rock types. This information is critical for accurate thickness estimations.
Seismic Data Interpretation: Seismic surveys provide a broader view of the subsurface structure. Techniques employed include:
- Reflection seismology: Uses reflected seismic waves to image subsurface layers, providing estimates of layer thickness across large areas. Careful interpretation is crucial to identify and map the specific horizons of interest.
- Seismic attribute analysis: Extracts additional information from seismic data, such as amplitude, frequency, and phase, to better define and map formations. This can improve the accuracy of thickness estimations, particularly in complex geological settings.
Outcrop Mapping and Measurement: Direct observation of exposed geological formations offers valuable ground-truthing data. This involves:
- Detailed geological mapping: Identifying and mapping the extent and thickness of geological units at the surface.
- Stratigraphic section measurement: Precise measurement of the thickness of individual strata within exposed sections. This provides essential calibration points for subsurface data.
Surface Geophysical Methods: These techniques complement well and seismic data, particularly in areas with limited well control:
- Gravity surveys: Measure variations in the Earth's gravitational field, which can indirectly indicate subsurface density changes and potentially formation thicknesses.
- Magnetic surveys: Measure variations in the Earth's magnetic field, useful in identifying magnetic mineral deposits and helping to infer the presence of specific rock units.
Chapter 2: Isopach Models and Their Applications
Isopach maps are essentially a visual representation of an underlying 3D model of formation thickness. Different geological models influence the interpretation and application of isopachs:
Simple Geometric Models: These assume simple geometrical shapes (e.g., planar, wedge-shaped) for the formations. While simplistic, they are useful for initial estimations and preliminary analyses.
Stratigraphic Models: These incorporate the principles of stratigraphy (layer deposition, erosion, unconformities) to build more realistic models of formation thickness distribution. These models account for complex depositional environments and tectonic events.
Geostatistical Models: These employ statistical methods (e.g., kriging) to interpolate formation thickness between data points. This is particularly useful when data coverage is sparse or uneven.
Dynamic Models: These incorporate aspects of geological processes (e.g., sedimentation rates, erosion, tectonic deformation) over time to predict the evolution of formation thickness. These models are sophisticated and require significant data input.
The choice of model depends on the specific geological setting, the available data, and the objectives of the study.
Chapter 3: Software for Isopach Mapping
Several software packages facilitate the creation and analysis of isopach maps:
Specialized Geoscience Software: Packages like Petrel, Kingdom, and SeisSpace offer advanced tools for data integration, 3D visualization, and isopach map generation. They often include functionalities for well log analysis, seismic interpretation, and geostatistical modeling.
GIS Software: ArcGIS and QGIS can be used to create and manipulate isopach maps, especially when integrating with other spatial datasets. Their strengths lie in data management, visualization, and map output.
Spreadsheet Software: While less sophisticated, spreadsheet programs like Excel can be used for simple isopach map generation, particularly for smaller datasets. However, they lack the advanced functionalities of specialized geoscience software.
The choice of software depends on the complexity of the project, the availability of resources, and the user's technical expertise.
Chapter 4: Best Practices in Isopach Mapping
Creating reliable isopach maps requires adherence to several best practices:
Data Quality Control: Rigorous quality control of all input data (well logs, seismic data, outcrop measurements) is crucial. Identifying and addressing data errors or inconsistencies is essential for accurate mapping.
Data Integration and Consistency: Data from different sources should be integrated carefully, ensuring consistency in units, coordinate systems, and stratigraphic interpretations.
Appropriate Interpolation Techniques: The selection of suitable interpolation methods depends on the data distribution and the geological setting. Careful consideration of the assumptions and limitations of different techniques is crucial.
Uncertainty Assessment: Quantification and visualization of uncertainty in isopach maps are essential for reliable interpretation. This might involve error propagation analysis or the creation of uncertainty maps.
Geological Interpretation and Validation: Isopach maps should be interpreted within a geological framework, considering the regional geological context and the relevant geological processes. Validation against independent data sources is recommended.
Chapter 5: Case Studies in Isopach Applications
Numerous case studies demonstrate the practical applications of isopach mapping:
Hydrocarbon Exploration: Isopach maps of reservoir formations help in estimating hydrocarbon reserves, guiding well placement, and optimizing production strategies. Examples abound in major petroleum provinces worldwide.
Groundwater Management: Isopach maps of aquifers are critical for assessing groundwater resources, managing water extraction, and predicting the impacts of groundwater development.
Coal Exploration: Isopach maps of coal seams provide essential information on coal thickness, quality, and extent, guiding mining operations.
Environmental Studies: Isopach maps of contaminant plumes can aid in remediation planning and risk assessment. They also are useful for studying sediment transport patterns and evaluating environmental impacts of various activities.
Tectonic Analysis: Comparing isopach maps of different geological units can reveal patterns of subsidence, uplift, and faulting, furthering our understanding of regional tectonic history.
These chapters provide a comprehensive overview of isopachs, encompassing their theoretical foundation, practical techniques, software tools, best practices, and real-world applications. The use of isopach maps remains an essential tool for earth scientists and resource managers in numerous disciplines.
- Demande de justification des dépenses Naviguer dans la de… Planification et ordonnancement du projet
- Coût budgété du travail planifié Comprendre le Coût … Estimation et contrôle des coûts
- Les limites de batterie Comprendre les limi… Termes techniques généraux
- Outil DV Outil DV : Un éléme… Forage et complétion de puits
- SOMMAIRE TOC : Comprendre le… Termes techniques généraux
Comments